
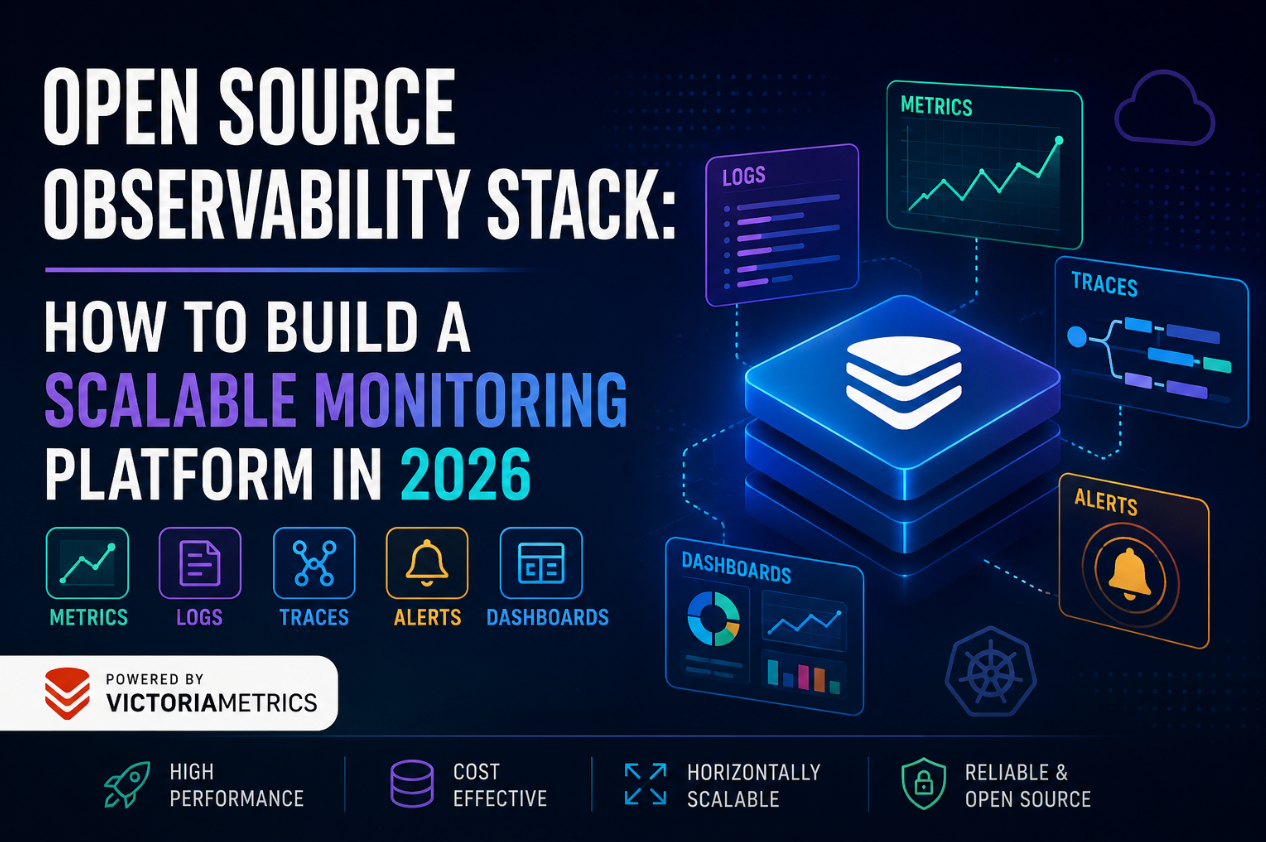
Modern applications generate more operational data than ever before. Between Kubernetes clusters, microservices, serverless workloads, cloud infrastructure, databases, and edge devices, engineering teams are responsible for monitoring millions, or even billions of data points every day. As systems become increasingly distributed, traditional monitoring solutions often struggle to keep pace.
This is why organizations are rapidly adopting open source observability stacks. They provide flexibility, eliminate vendor lock-in, reduce operational costs, and allow teams to customize their monitoring infrastructure according to their unique requirements.
In this guide, we’ll explore how to build a scalable observability platform in 2026, the essential components every engineering team should include, and the best practices for designing a monitoring architecture that continues to perform as your infrastructure grows.
Why Observability Matters More Than Ever
Monitoring has evolved significantly over the last decade.
Traditional monitoring focused primarily on infrastructure metrics such as CPU usage, memory consumption, and disk utilization. While these metrics remain important, modern applications require much deeper visibility into distributed systems.
Observability goes beyond basic monitoring by enabling engineers to answer questions they didn’t anticipate beforehand. Instead of simply detecting that something is wrong, observability helps teams understand why it happened.
A complete observability strategy combines three major data sources:
- Metrics
- Logs
- Traces
Together, these signals provide a complete picture of application health, infrastructure performance, and user experience.
What Is an Open Source Observability Stack?
An open source observability stack is a collection of community-driven tools that work together to collect, store, process, visualize, and analyze telemetry data across your infrastructure.
Rather than relying on a single proprietary vendor, organizations can choose best-of-breed components that integrate seamlessly while maintaining complete control over their data.
A modern observability stack typically includes:
- Metrics collection
- Time-series database
- Log aggregation
- Distributed tracing
- Dashboards
- Alerting
- Service discovery
- Long-term storage
Many engineering teams choose an Open Source Observability Platform that combines these capabilities into a scalable ecosystem while remaining fully compatible with popular open-source standards.
Core Components of a Modern Observability Platform
1. Metrics Collection
Metrics remain the foundation of observability.
Applications continuously expose measurements such as:
- Request latency
- Error rates
- CPU usage
- Memory utilization
- Database queries
- Network traffic
- Queue depth
Prometheus-compatible exporters remain the industry standard for collecting these metrics.
- Time-Series Database
Once metrics are collected, they need to be stored efficiently.
As organizations scale, storing millions of samples every second becomes increasingly challenging.
An ideal time-series database should provide:
- High compression
- Fast ingestion
- Low storage costs
- Horizontal scalability
- Long-term retention
- High availability
Without a scalable storage layer, monitoring systems often become the bottleneck rather than the solution.
- Log Management
Logs provide detailed context around application behavior.
Unlike metrics, logs capture individual events, including:
- Application errors
- Authentication failures
- Deployment events
- API responses
- Security incidents
Centralized log aggregation enables engineers to troubleshoot incidents quickly without manually searching multiple servers.
- Distributed Tracing
Microservices introduce complexity.
A single user request may travel through dozens of services before returning a response.
Distributed tracing allows engineers to visualize that complete journey, making it much easier to identify latency issues or failing services.
- Dashboards
Raw telemetry is difficult to interpret.
Visualization tools transform millions of data points into meaningful dashboards that help engineering teams monitor system health in real time.
Common dashboards include:
- Infrastructure health
- Kubernetes clusters
- Database performance
- API latency
- Application uptime
- Business KPIs
Well-designed dashboards reduce incident response times significantly.
- Alerting
Monitoring without alerting provides little operational value.
Modern alerting systems notify engineers when predefined thresholds or anomalies occur.
Effective alerting focuses on actionable incidents rather than generating excessive noise.
High-quality alerts should be:
- Timely
- Accurate
- Context-rich
- Actionable
Reducing alert fatigue remains one of the most important goals for SRE teams.
Building a Scalable Monitoring Architecture
A scalable observability platform isn’t built by simply installing monitoring software.
Instead, it requires careful architectural planning.
A common architecture looks like this:
Applications → Exporters → Metrics Collection → Time-Series Database → Dashboards → Alerting
Alongside this pipeline:
Applications → Log Collector → Log Storage
Applications → Trace Collector → Trace Storage
This layered approach allows every component to scale independently as workloads increase.
Why Open Source Is Winning in 2026
Organizations increasingly prefer open-source solutions for several reasons.
Lower Costs
Licensing fees for commercial observability platforms can become extremely expensive as telemetry volumes grow.
Open-source solutions significantly reduce infrastructure costs while allowing organizations to invest more in engineering improvements.
No Vendor Lock-In
Engineering teams retain full ownership of their monitoring infrastructure.
Data remains portable, allowing organizations to migrate, customize, or extend their platform whenever necessary.
Large Community Support
Popular open-source projects benefit from thousands of contributors who continuously improve performance, security, and integrations.
This rapid innovation often exceeds proprietary alternatives.
Greater Flexibility
Organizations can deploy observability infrastructure:
- On-premises
- Public cloud
- Private cloud
- Hybrid environments
- Multi-cloud architectures
This flexibility is especially valuable for enterprises with complex compliance requirements.
Conclusion
As modern applications become more distributed and data-intensive, building a scalable observability stack is no longer optional—it’s a critical part of maintaining reliable, high-performing systems. By combining metrics, logs, traces, dashboards, and intelligent alerting into a unified monitoring strategy, organizations gain the visibility needed to detect issues faster, troubleshoot efficiently, and deliver a better user experience.
Open-source observability solutions have become the preferred choice for many engineering teams because they offer flexibility, scalability, cost efficiency, and freedom from vendor lock-in. Whether you’re monitoring a small Kubernetes cluster or a globally distributed cloud infrastructure, choosing the right architecture and tools ensures your monitoring platform can grow alongside your business.
VictoriaMetrics provides a powerful Open Source Observability Platform designed to help organizations build scalable, high-performance monitoring environments. With fast metrics ingestion, efficient storage, excellent query performance, and seamless compatibility with the Prometheus ecosystem, VictoriaMetrics enables teams to monitor modern cloud-native workloads with confidence while keeping operational costs under control.
Frequently Asked Questions (FAQs)
1. What is an open source observability stack?
An open source observability stack is a collection of open-source tools used to collect, store, analyze, and visualize telemetry data such as metrics, logs, and traces. It helps engineering teams monitor infrastructure, applications, and distributed systems while maintaining full control over their data.
2. What are the three pillars of observability?
The three pillars of observability are:
- Metrics – Numerical data that measures system performance and health.
- Logs – Detailed event records generated by applications and infrastructure.
- Traces – End-to-end request tracking across distributed services.
Together, these telemetry signals provide the context needed to identify and resolve issues quickly.
3. Why should organizations choose an open source observability platform?
Open-source observability platforms offer several advantages, including lower operational costs, no vendor lock-in, greater deployment flexibility, and strong community support. They also allow organizations to customize their monitoring environment and integrate with a wide range of cloud-native technologies.
4. What components are essential in a modern observability stack?
A modern observability stack typically includes:
- Metrics collection
- Time-series database
- Log aggregation
- Distributed tracing
- Visualization dashboards
- Alerting
- Service discovery
- Long-term storage
These components work together to provide comprehensive visibility into application and infrastructure performance.
5. How does observability differ from traditional monitoring?
Traditional monitoring focuses on predefined metrics and alerts, helping teams identify when something has gone wrong. Observability goes a step further by enabling engineers to investigate unknown issues using correlated metrics, logs, and traces, making it easier to determine the root cause of complex problems.
6. Can an open source observability stack scale for enterprise workloads?
Yes. Modern open-source observability solutions are designed to handle enterprise-scale environments, supporting millions of metrics per second, long-term data retention, high availability, and horizontal scalability. With the right architecture, they can efficiently monitor large Kubernetes deployments, hybrid cloud environments, and globally distributed applications.
7. What should I look for when choosing an observability platform?
When evaluating an observability platform, consider factors such as scalability, query performance, storage efficiency, compatibility with open standards, ease of deployment, alerting capabilities, and support for cloud-native environments. Choosing a platform that integrates seamlessly with your existing monitoring ecosystem will help simplify operations and future-proof your infrastructure.
